

AI-generated summary
Meetings, lessons, and reports often scatter ideas across minds. Visual thinking fixes that by turning thoughts into shared, observable representations—simple drawings, diagrams, maps, keywords, and spatial layouts—that everyone can see, discuss, and revise. It’s not about artistic skill but about using a minimal visual vocabulary (shapes, lines, icons, containers, size, color, and placement) to clarify relationships, priorities, and processes. Drawing even roughly fosters deeper processing: choosing what matters, grouping elements, and exposing dependencies, which improves understanding and memory.
Educationally, visual thinking helps students summarize, connect, and recall concepts (sketchnotes, mind maps, murals), and supports inclusive, collaborative learning. In business, graphical facilitation turns messy conversations into shared canvases—grouping duplicates, revealing contradictions, assigning actions—useful in multidisciplinary teams and methods like Design Thinking and Agile. Digital whiteboards (Miro, Mural, Excalidraw) enable remote collaboration but don’t replace good visual practice. Cautions: visuals select and simplify, so they must represent uncertainty and avoid hiding nuance. Ultimately, visual thinking is a practical tool to externalize and negotiate ideas, making complexity manageable and often revealing insights that text alone can obscure.
Visual thinking uses simple drawings, words, arrows, diagrams, and spatial relationships to make ideas visible. It does not require knowing how to draw: it consists of transforming complex information into a representation that helps to understand, remember, communicate, and solve problems.
A meeting ends after an hour. Eight people have spoken, twenty ideas have appeared, and when everyone leaves the room, each participant seems to have taken a slightly different version of what was agreed.
Now imagine the same conversation with the main ideas visible on a wall: objectives within a box, problems grouped by topic, arrows showing dependencies, questions marked with a symbol, and next steps connected to those responsible.
The conversation remains the same. What changes is that thought has left our heads and has become something that everyone can observe, discuss, and modify.
That is the fundamental principle of visual thinking.
It is not about making beautiful drawings. Nor is it about replacing texts with illustrations. It is about using images, words, symbols, shapes, and spatial relationships to think better about information.
In education, it can help a student understand a concept, summarize a topic, or connect ideas. In a business, it can be used to explain a strategy, represent a process, facilitate a meeting, or find relationships that were hidden within a fifty-page report.
What is visual thinking?
Visual thinking is a way of organizing, processing and communicating information through visual representations such as simple drawings, diagrams, maps, symbols, keywords, connectors and spatial structures.
Its objective is not to produce a work of art. Drawing works as a cognitive tool.
One of the great historical references of the concept is the psychologist Rudolf Arnheim. In 1969 he published Visual Thinking, a work in which he questioned the traditional separation between perception and thought and defended the importance of perceptual processes within reasoning. More than half a century later, the idea is especially current.
We work with enormous amounts of information, data, presentations, emails, and documents. In that context, visually representing a problem can work as a way to reduce complexity without removing the reasoning it contains.
Visual thinking does not mean knowing how to draw
This is probably the main barrier to entry. “I don’t know how to draw.” You don’t have to.
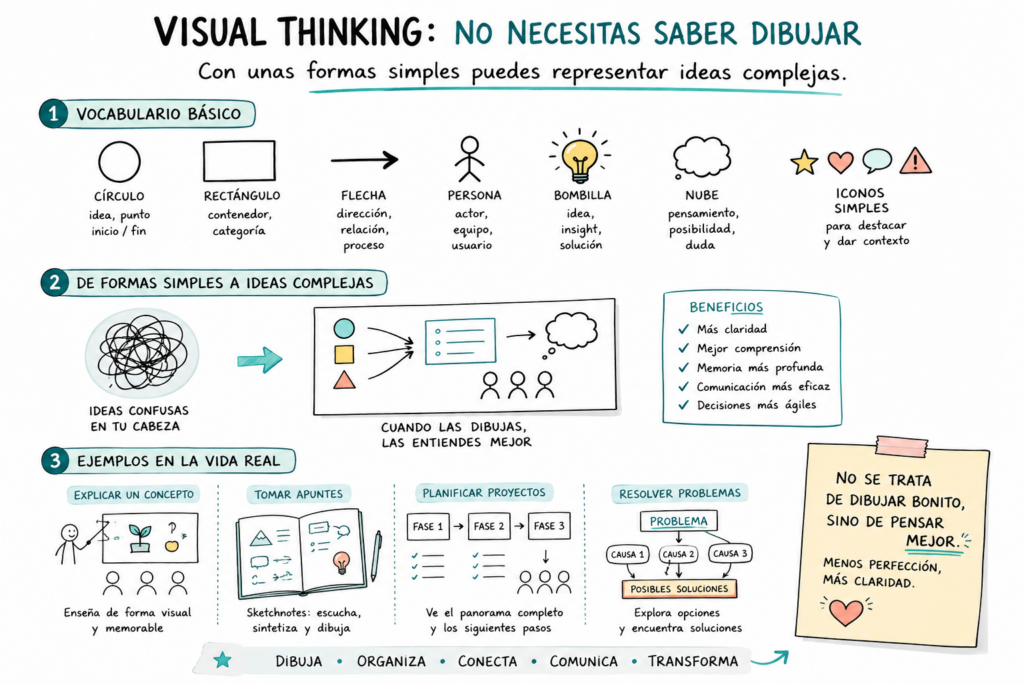
To use visual thinking we need a surprisingly small vocabulary:
- circles and rectangles;
- lines and arrows;
- people represented with basic strokes;
- very simple icons;
- containers;
- keywords;
- sizes and colors;
- spatial relationships.
An arrow can mean cause, movement, or dependence. A circle can group related elements together. A dashed line can represent an uncertain relationship. The goal is for our idea to be understood.
Research on the so-called drawing effect is particularly interesting at this point. In a series of experiments, researchers at the University of Waterloo found memory advantages when participants drew concepts versus when they simply wrote them down. The benefits appeared under different conditions and did not depend on possessing great artistic ability.
Paradoxically, drawing poorly may be perfectly enough to think well.
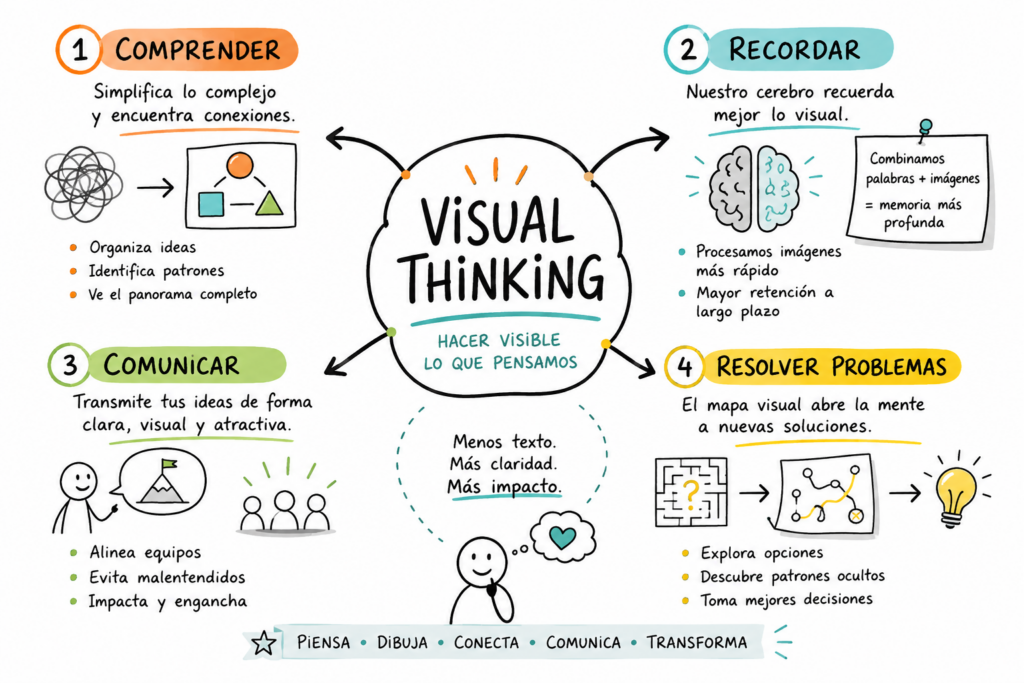
Why can visuals help with learning?
Here it is advisable to avoid a widespread simplification. It is often repeated that “the brain processes images 60,000 times faster than text” or similar variants. There is no solid scientific reference that allows this figure to be used as a general property of the human brain.
The Theory of Dual Coding
Psychologist Allan Paivio developed the theory of dual coding, according to which we work with related systems to represent verbal and nonverbal information.
Words and visual representations can create connections between different ways of representing knowledge. Educational research has included dual coding among the strategies supported by decades of work on learning and memory.
That doesn’t mean that putting a photograph next to any text automatically improves learning. The image should provide information or help organize it.
In fact, research on multimedia learning also warns of the so-called seductive details effect: interesting but irrelevant images or elements can add cognitive load and end up impairing comprehension.
The practical principle is simple: a good visual representation reduces noise; a bad visual representation can add to it.
Drawing forces you to transform information
There is also another reason why making your own outline can be different from copying a paragraph.
To draw an idea we need to decide:
- What is important?
- What is the relationship between these elements?
- What can I eliminate?
- What should the center occupy?
- What depends on what?
In other words, we must process and reconstruct information.
Recent research continues to explore this effect. Two pre-registered experiments published in 2025 found that, compared to writing, drawing generated more visual and elaborate thoughts and was associated with better later recall.
This connects naturally with another concept we’ve addressed in this series: computational thinking. Both try to make complexity manageable, although they do it differently. Computational thinking breaks down, abstracts, and structures procedures. Visual thinking externalizes concepts and relationships so that they can be observed together.
How to do visual thinking: a step-by-step guide
You don’t need to start with a big infographic; a sheet of paper and a pen are enough. The process would be as follows:
1. Define the central question
Every canvas needs a hub. Don’t just write “Marketing.” Formulate something more useful: Why are we losing customers? or How does adaptive learning work?
The question helps decide what information deserves to be included in the drawing.
2. Extract concepts, not sentences
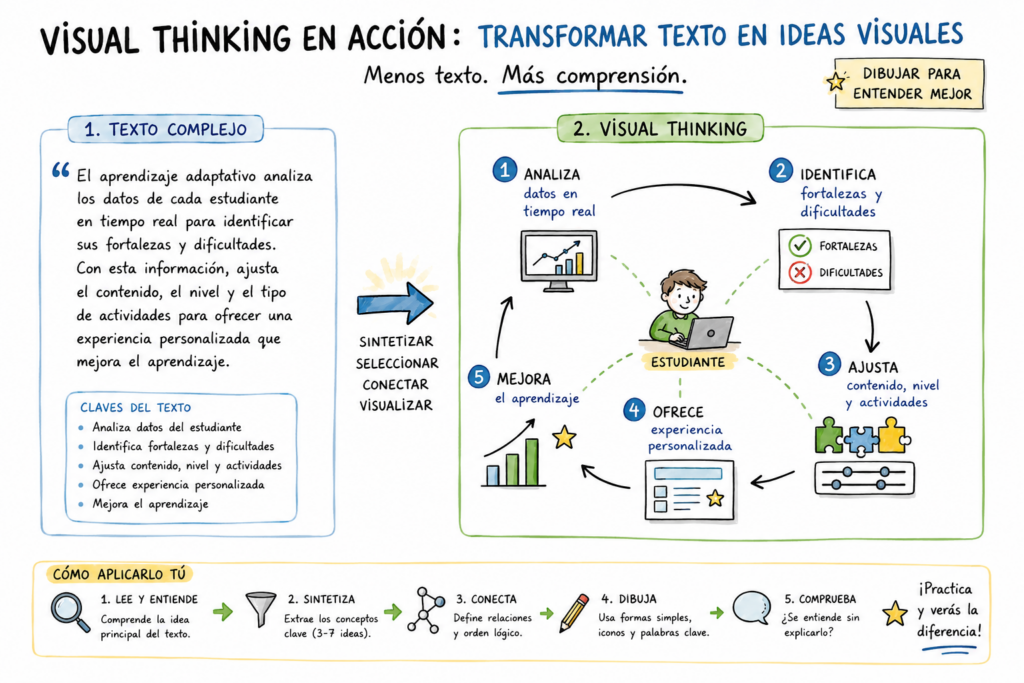
A common mistake is to try to translate an entire text onto the canvas. Visual thinking requires synthesizing. Instead of writing, “The system continuously analyzes the student’s responses to determine their strengths and difficulties.”
We can extract: answers → analysis → diagnosis → adaptation
We already have a structure.
3. Turn relationships into space
Now comes the truly visual part.
Which concept comes first?
Which element depends on another?
Which two ideas belong to the same group?
What is a cause and what is a consequence?
Physically placing ideas forces you to make those decisions.
4. Use a minimal graphic vocabulary
Don’t draw a real university. Draw a building with three columns.
Don’t draw a real computer. A rectangle with a small base is enough.
Don’t draw a perfect light bulb. A circle with five lines can represent an idea. The drawing must be quick because its function is to think, not to decorate.
5. Introduce hierarchy
Not everything can be the same size.
Use titles, containers, color, or thickness to separate:
main idea → blocks → details.
The reader should be able to understand the overall structure first and then zoom in on the detail.
6. See if it works without explanation
Look at the result for ten seconds.
Can you understand what the problem is?
Where does it start?
Where does it end?
Are the important relationships distinguished?
If you need to verbally explain each line of the drawing, you can probably still simplify it.
Practical exercise: explain a complex idea on a single sheet of paper
Let’s try a concept from this same series: adaptive learning.
The goal will be to explain it to someone who has never heard of it.
Step 1. Write in the center:
“Adaptive learning”.
Step 2. Around it place four elements:
“Student”, “data”, “algorithm” and “content”.
Step 3. Connect the process:
Student → performs activity → generates data → system analyzes → adapts content → student
Step 4. Add only three types of data: “hits,” “mistakes,” and “time.”
Step 5. Enter two possible decisions: “reinforce” or “move forward.”
In a few minutes, we’ve turned several paragraphs into a map.
Now we can detect something that linear text partially hid: it’s a cycle.
That discovery is precisely the value of visual thinking. We don’t always simplify just to communicate later. Sometimes we see something new while representing the problem.
Visual thinking in education
The classroom is one of the environments where visual thinking finds the most obvious applications.
It can be used by the teacher to explain, but also by the student himself to build a representation of what he or she has understood.
Sketchnotes
Sketchnotes combine words, drawings, arrows, frames, and other visual elements to take notes. They do not seek to literally transcribe an explanation. They force you to select and relate.
Mind and concept maps
Maps allow us to represent hierarchies and relationships that are difficult to perceive in a linear list. They are especially useful when we need to understand systems with many components: an ecosystem, a historical event, a theory, or the different parts of a project.
Murals and collective explanations
Visual thinking can also become a collaborative activity. A group can jointly build a mural about the causes of an event, represent a scientific process or visualize different arguments around a debate.
The University of Seville has published works that describe drawing and visual thinking as resources applicable in education, including contexts with vulnerable populations.
The University of Malaga has also explored educational proposals that combine visual thinking, game-based learning and digital tools, showing how these methodologies can be integrated into broader pedagogical designs.
It’s a good reminder that visual thinking doesn’t have to work in isolation. It can coexist with gamification, blended learning models, or problem-solving activities.
At the Bankinter Innovation Foundation we have already pointed out precisely the importance of innovative educational projects developing creativity, critical thinking, communication, collaboration and problem-solving, skills that well-planned visual work can help to exercise.
Visual thinking in the company: making a conversation visible
In an organization, the problem is usually not a lack of information. Often it’s exactly the opposite: we have too many slides, documents, data, meetings, and opinions.
Graphical facilitation tries to transform complex conversations into a shared representation.
Let’s imagine a meeting to launch a new product. We can build a canvas with five zones:
customer problem | solution | hypothesis | risks | next steps
Each participant adds information.
- Duplicate ideas are grouped together.
- Contradictions become visible.
- Open questions are pointed out.
- Decisions are connected to actions.
At the end, the team has a record and a shared model of the conversation.
This is especially useful in multidisciplinary teams, where the same word can mean different things for engineering, marketing, finance or design.
At Bankinter Innovation Foundation we have addressed this need by analysing the Agile and Design Thinking methodologies, which use structured processes to enhance creativity, collaboration and adaptation within companies.
Visual thinking can function as a common language within these processes.
Visual thinking as a tool to solve problems
Visual representation also has a virtue that goes beyond communicating. It allows you to manipulate the problem:
- We can move an element.
- Group two causes.
- Draw a new relationship.
- Delete an activity.
- Discover a bottleneck.
In text, ideas necessarily appear one after the other. On a canvas, we can observe them simultaneously. This is especially powerful when we work with systems.
Think about the onboarding process of a new customer. Drawing each step allows you to detect redundant approvals, duplicate tasks, or unnecessary journeys.
Or imagine a startup trying to understand why it doesn’t convert free users into paying customers. A map can connect acquisition, activation, utilization, price, support, and churn.
Drawing doesn’t automatically provide the answer. What it does is change the surface we think about.
Visual thinking vs. design thinking: are they the same?
No. Although they usually appear together, they serve different functions:
| Visual thinking | Design thinking |
| It is a way of representing and processing ideas visually | It is a broader methodology for solving problems It can |
| be used in minutes | It is usually structured in several phases |
| It seeks to understand and communicate | It seeks to investigate, ideate, prototype and validate solutions |
| It can be applied individually | It usually involves working with users and teams |
| It is a tool | It is a methodological process |
Design Thinking frequently uses visual techniques: empathy maps, customer journeys, diagrams, prototypes or affinity maps.
That is why both approaches complement each other very well. While Design Thinking provides us with a process to move from a problem to a solution, visual thinking can help us to make visible what we discover during this journey.
The Foundation has also analysed this combination of creativity, collaboration and innovation structures in its content on Design Thinking and Agile methodologies.
Digital tools for visual thinking
Visual thinking doesn’t need technology.
But digital whiteboards have eliminated one of the historical limitations of a physical wall: now a distributed team can work simultaneously on the same canvas. Here are some of the most commonly used:
Miro
Miro offers a collaborative canvas with notes, shapes, diagrams, and templates for techniques such as Design Thinking, storyboarding, maps, and brainstorming. Its current focus has expanded into a space for visual innovation and real-time or asynchronous collaboration.
Mural
Mural is especially geared towards visual collaboration and team facilitation. It allows you to work with notes, outlines, maps, polls, and templates, and offers features designed for meetings and workshops, including hybrid and remote environments.
Excalidraw
Excalidraw takes a deliberately simple approach: a collaborative whiteboard with freehand drawing aesthetics, especially useful for quick diagrams, flows, and visual explanations. Its basic version can be used directly in the browser without registration.
For education, it also offers uses such as mind maps, diagrams, brainstorming, and real-time co-creation.
The tool, again, is secondary; a digital whiteboard with a hundred functions doesn’t turn a meeting into visual thinking if we end up filling it with a hundred paragraphs of text.
When the visual can also oversimplify
Every representation is a selection, and every selection leaves something out.
A process map can hide exceptions. An infographic can remove nuances. A causal diagram can make a complex relationship seem more secure than it really is. The goal of visual thinking should not be to make everything look simple, but to make a complexity more manageable without distorting it.
That’s why it’s always worth asking yourself: What did I remove to create this drawing? Were those details really irrelevant?
This caution is particularly important in scientific, social, or strategic problems where there are uncertain relationships and multiple causes.
A good map should also be able to represent doubt.
From the folio to shared knowledge
Visual thinking seems like a simple technique because its tools are:
- A circle.
- An arrow.
- Three words.
- A color.
But behind these elements there is a rather sophisticated intellectual operation: deciding how an idea is organized.
To draw a concept we must identify the essential, discover relationships, build hierarchies and discard noise.
To draw a problem in a group we also need to negotiate how we understand it.
That is why visual thinking can be useful both for a student trying to understand a subject and for a management team that needs to decide on a strategy.
And it connects well with many of the methodologies we have covered in this series: computational thinking helps to structure problems. Gamification can turn them into challenges. Blended learning allows you to work on them inside and outside the classroom and learning analytics provide data on how learning develops.
Visual thinking adds something different: a shared surface in which to make visible what we are trying to understand.
In an age where we can generate virtually unlimited amounts of text with digital tools and artificial intelligence, perhaps that ability to synthesize, connect, and visually represent ideas is even more valuable. Because thinking visually is not about drawing what we already know. It is often about drawing to discover what we really think.
Frequently asked questions about visual
thinkingDo I need to know how to draw to do visual thinking?
No. Research on the drawing effect has found memory benefits that do not depend on the artistic quality of the drawing. The important thing is to actively transform information through one’s own representation, not to produce an aesthetic illustration.
Is visual thinking the same as making mind maps?
No. Mind maps are a specific technique of visual representation. Visual thinking is a broader concept that can include maps, diagrams, drawings, sketchnotes, flows, visual metaphors, and graphic facilitation.
Does it work in remote environments?
Yes. Tools such as Miro, Mural or Excalidraw allow several people to work on the same canvas in real time and, in some cases, also asynchronously.
What applications does it have outside of education?
It can be used for business strategy, planning, product design, systems explanation, meeting facilitation, innovation, customer journeys, processes, research, decision-making, or complex information communication.
Is an image better than text for learning?
Not necessarily. Evidence on dual coding supports the value of properly combining verbal and visual information, but adding irrelevant images does not automatically enhance learning and may even introduce distractions. The point is not to choose between text and image, but to use the representation that best helps to understand the content.